

When developing a Formula Student race car, CATIA Surface Analysis is an essential step before running any Computational Fluid Dynamics (CFD) simulation. While CFD often receives most of the attention, the quality of the CAD model has a direct impact on mesh generation, simulation stability, and the reliability of the results.
A model may look perfectly smooth on the screen, but even small gaps, poor surface transitions, or subtle continuity issues can complicate meshing and reduce the accuracy of a CFD study. That’s why validating the geometry before simulation is just as important as configuring the solver itself.
During my second season with the Konrul Racing Team, I had the opportunity to evaluate one of our later-stage bodywork prototypes using the 3DEXPERIENCE platform. My goal wasn’t simply to run a CFD simulation—I first wanted to understand the quality of the geometry itself.
In this article, I’ll walk through the workflow I followed, starting with CATIA Surface Analysis and continuing through geometry preparation before evaluating the bodywork in SIMULIA CFD. Along the way, I’ll share what worked well, the challenges I encountered, and the lessons I learned.
The images below show the Formula Student bodywork prototype that served as the basis for this study before moving into the surface analysis workflow.
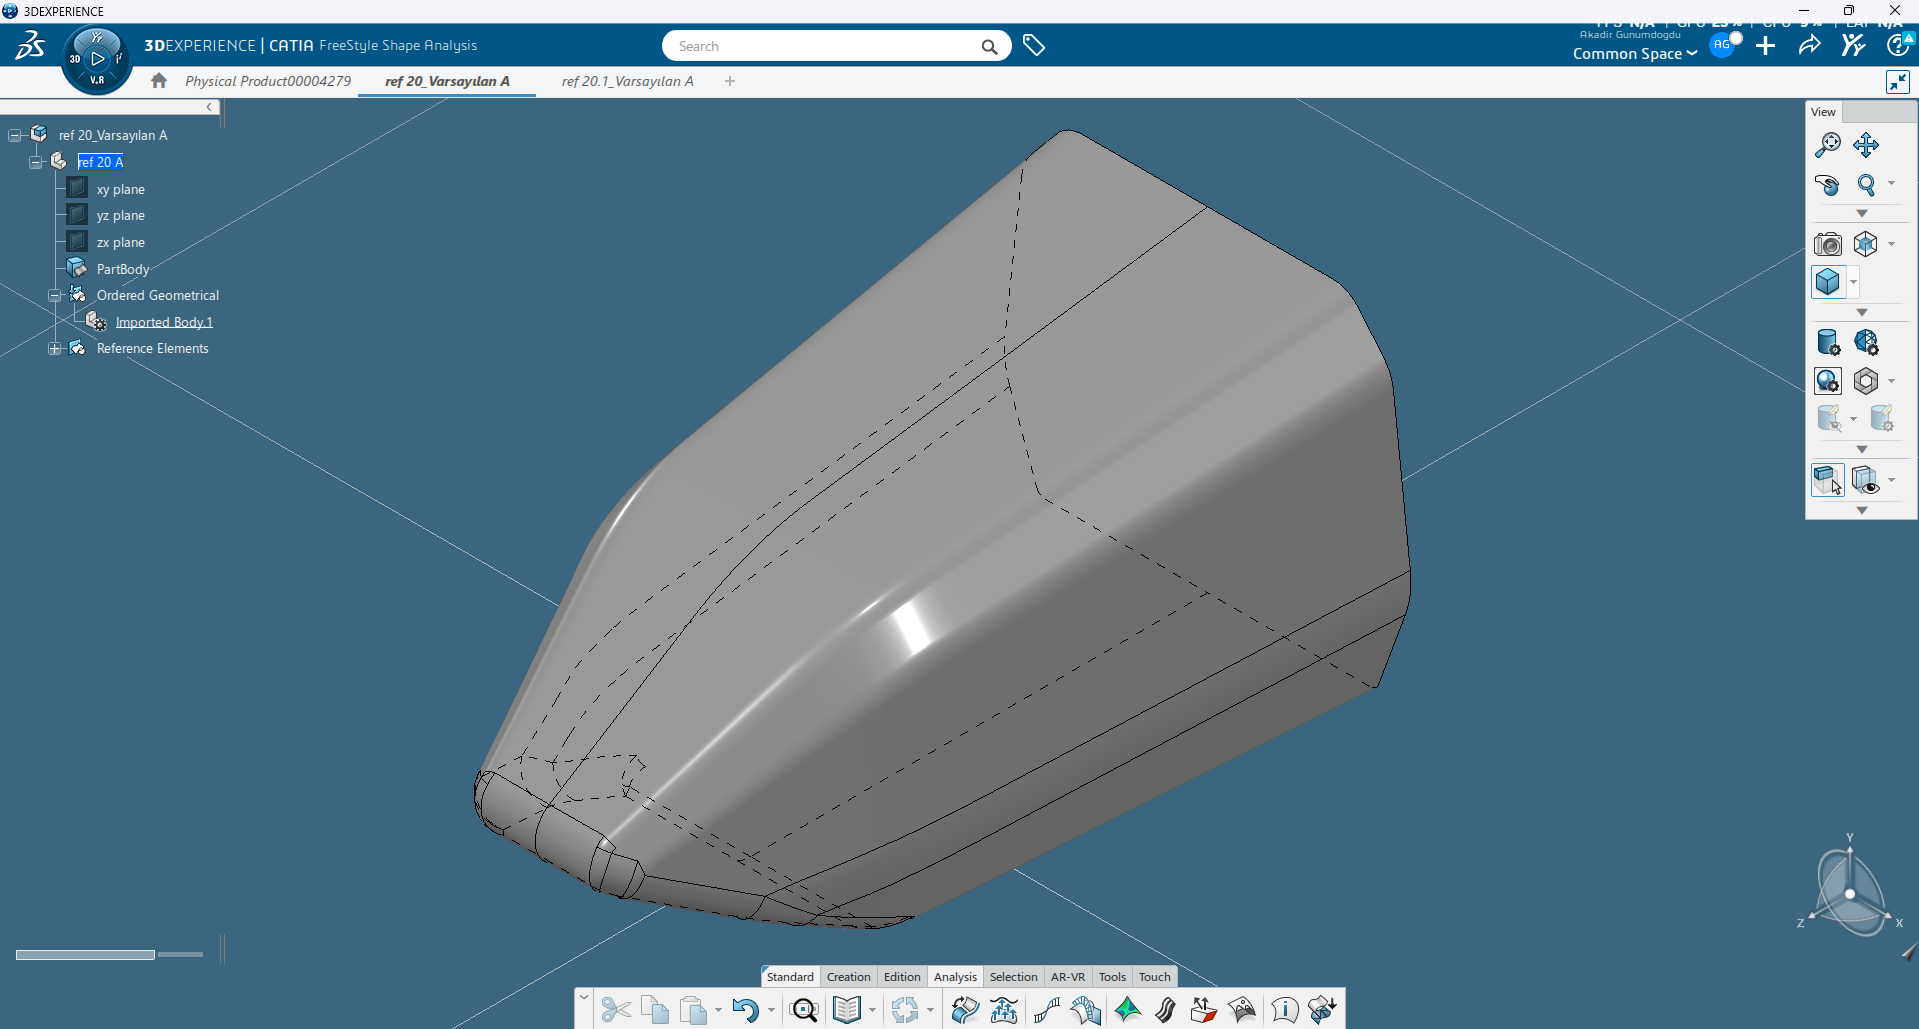
Figure 1. Isometric view of the Formula Student bodywork prototype.
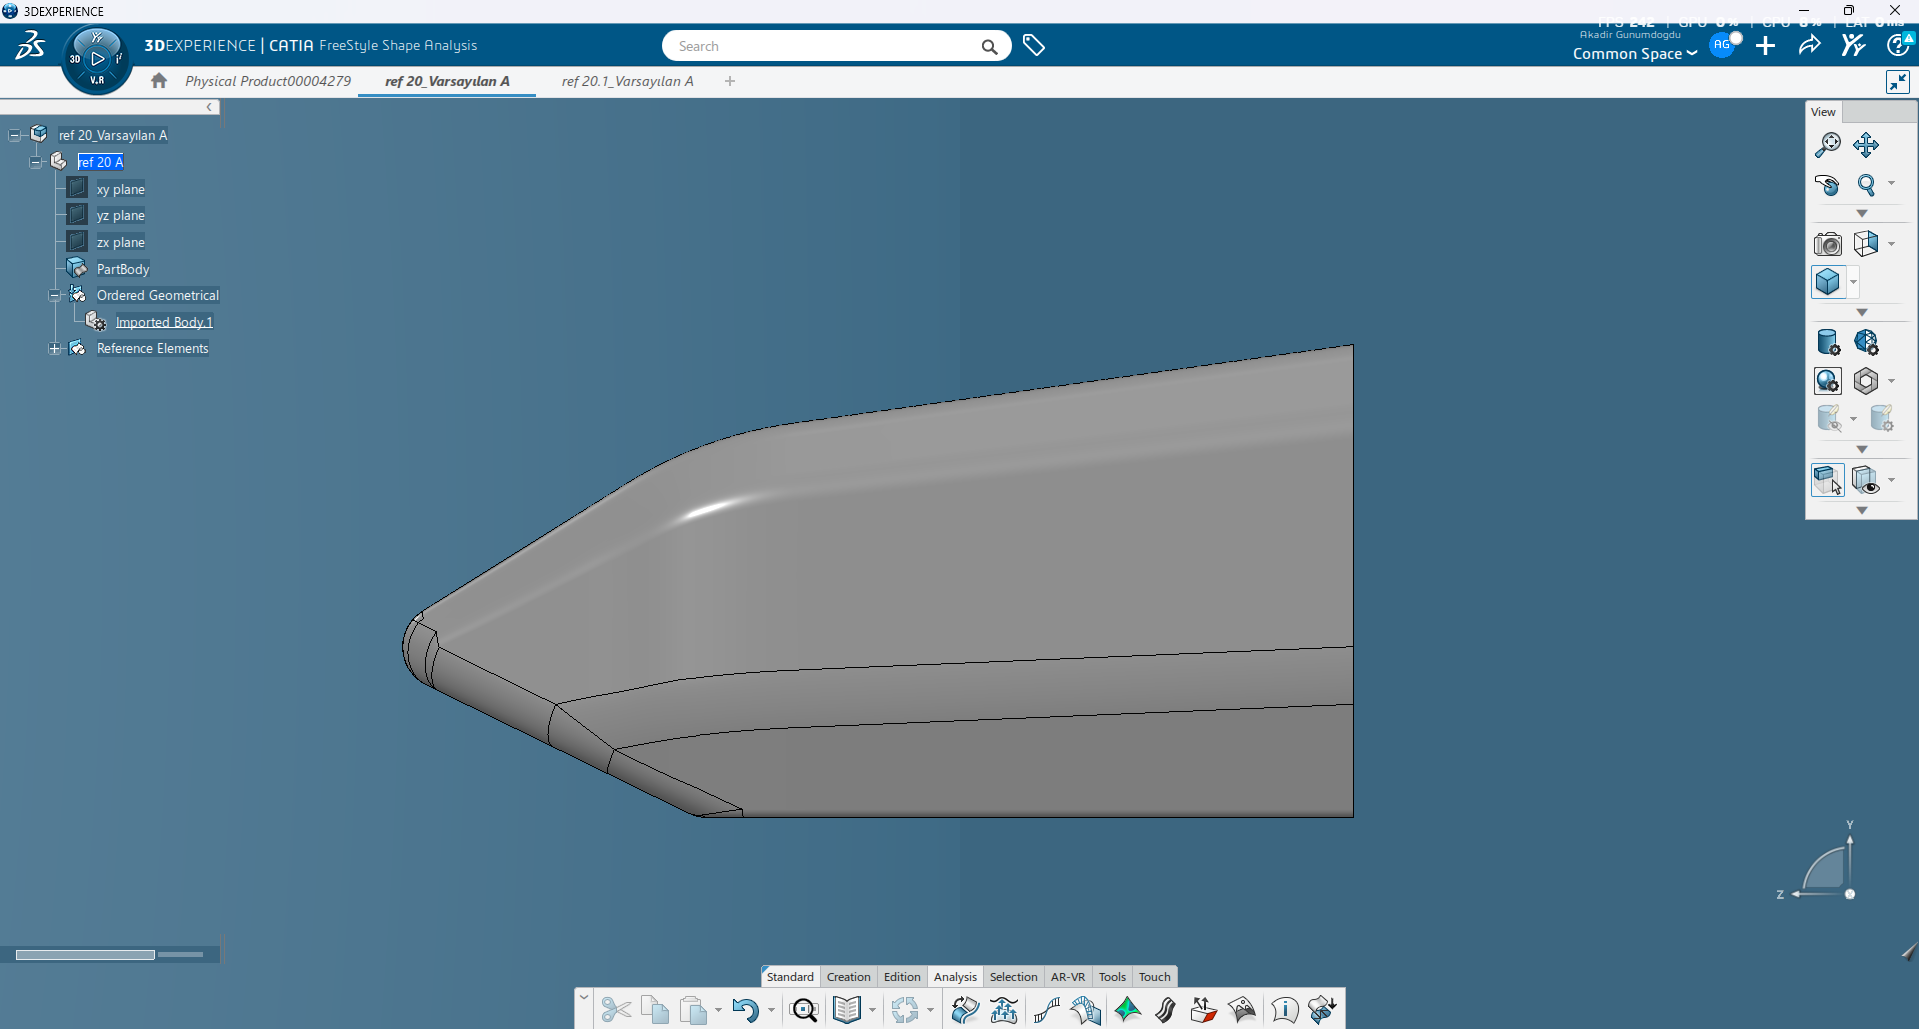
Figure 2. Side view highlighting the nose profile and surface transitions.
Before moving into CFD, I wanted to answer a simple question: Were the bodywork surfaces really as smooth as they appeared?
While working through the Dassault Systèmes learning content, I realized that CATIA offers much more than powerful surface modeling tools. It also includes several analysis tools that make it possible to inspect reflection patterns, surface continuity, and curvature in detail.
Although these analyses don’t predict aerodynamic performance on their own, they help identify geometric issues that could create problems later during geometry preparation, mesh generation, or the CFD simulation itself.
For that reason, I decided to validate the bodywork using CATIA’s surface analysis tools before importing the model into SIMULIA. The goal was to identify potential weak areas early and create a cleaner, more reliable model for simulation.
Checking Surface Flow Before CFD
The first tool I used to evaluate the bodywork was Zebra Analysis, also known as Isophotes Analysis. Before preparing the model for CFD, I wanted to verify whether the surfaces were truly smooth—not just visually, but from a geometric perspective.
Zebra Analysis treats the model as a reflective surface, displaying alternating black and white stripes across the geometry. If those stripes flow smoothly from one surface to another, it generally indicates good continuity. On the other hand, sudden breaks, pinching, or abrupt changes in direction can reveal areas that deserve a closer look.
Rather than relying on the standard shaded view, I used Zebra Analysis to inspect how reflections behaved across the bodywork. My focus was on identifying transitions where the stripe pattern changed unexpectedly, as these areas could potentially create challenges during geometry preparation or mesh generation.
One feature I particularly appreciated is the flexibility CATIA offers. The software allows you to adjust stripe density, thickness, sharpness, orientation, and projection mode, making it easier to inspect complex surfaces from different angles. Looking at the same geometry from multiple directions often reveals imperfections that are difficult to spot in a conventional display.
Although Zebra Analysis doesn’t provide aerodynamic data, it plays an important role in preparing a model for CFD. Cleaner and more continuous surfaces generally lead to more robust geometry, smoother meshing, and fewer issues during simulation.
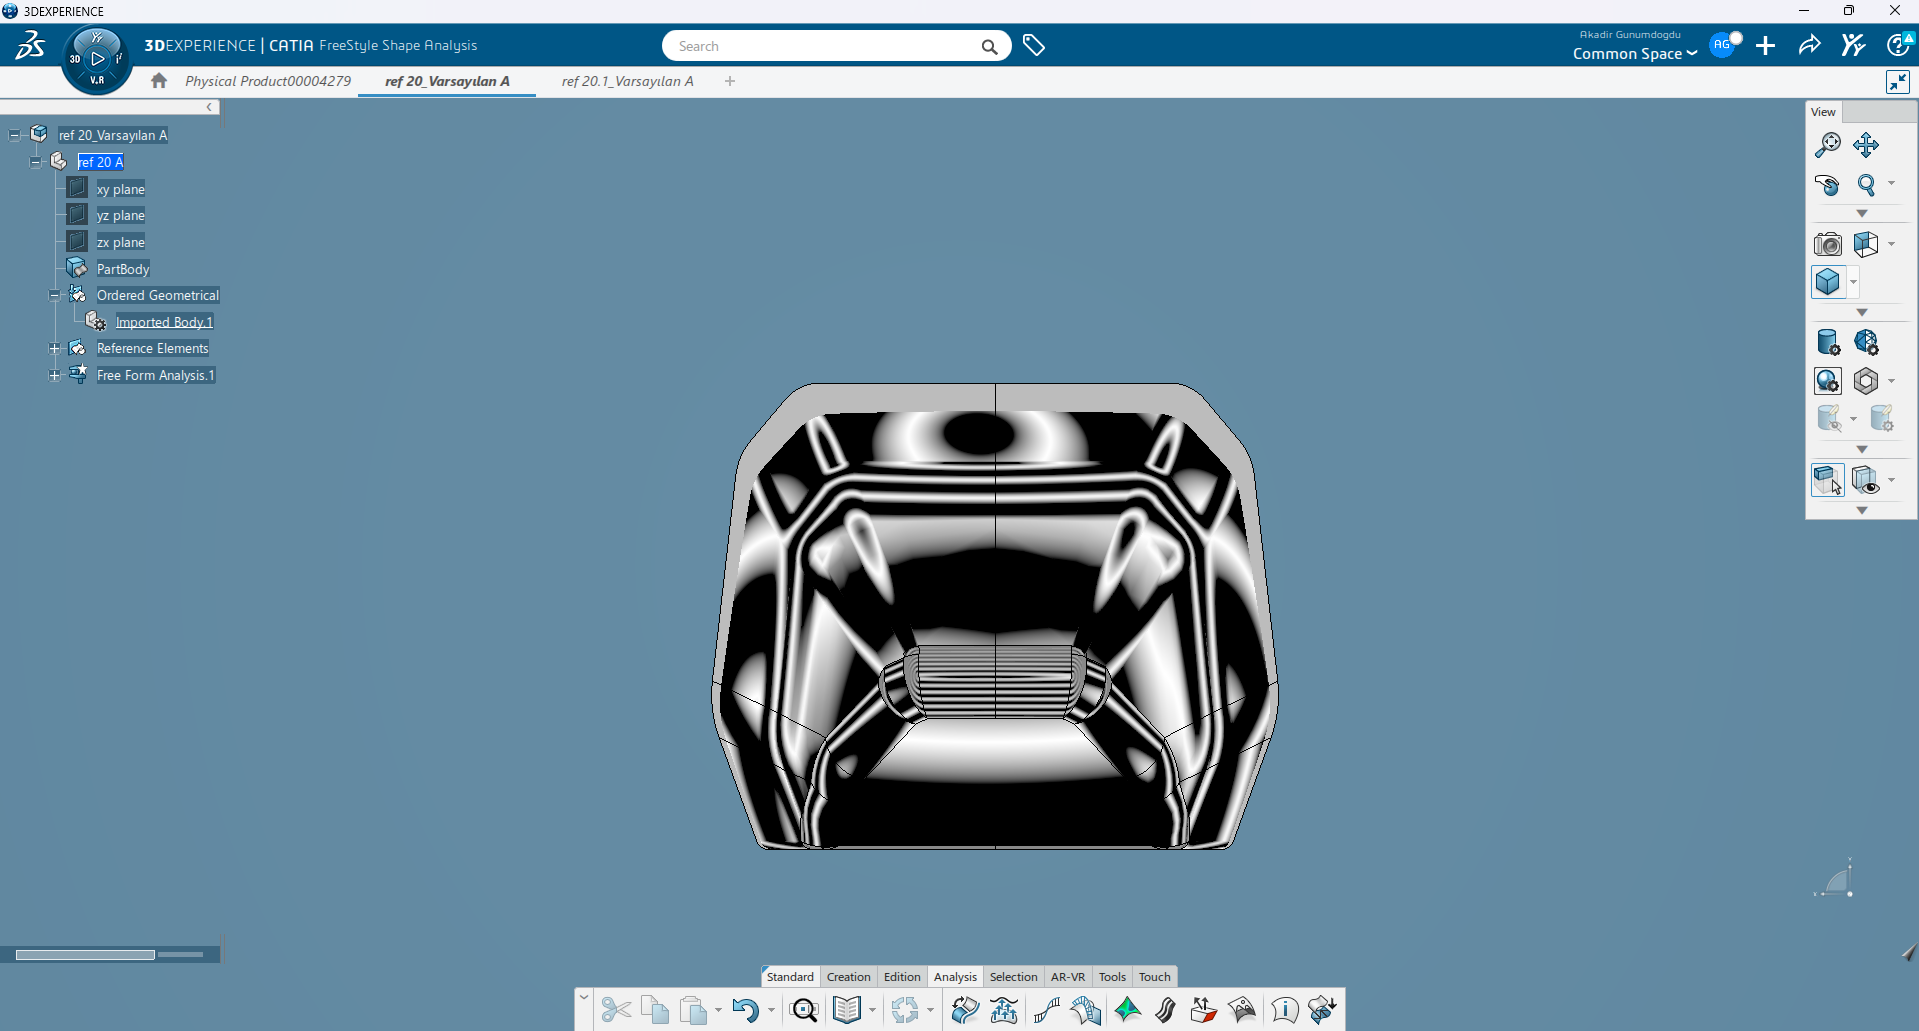
Figure 3. Front view of the Zebra Analysis highlighting the nose and lower bodywork transitions.
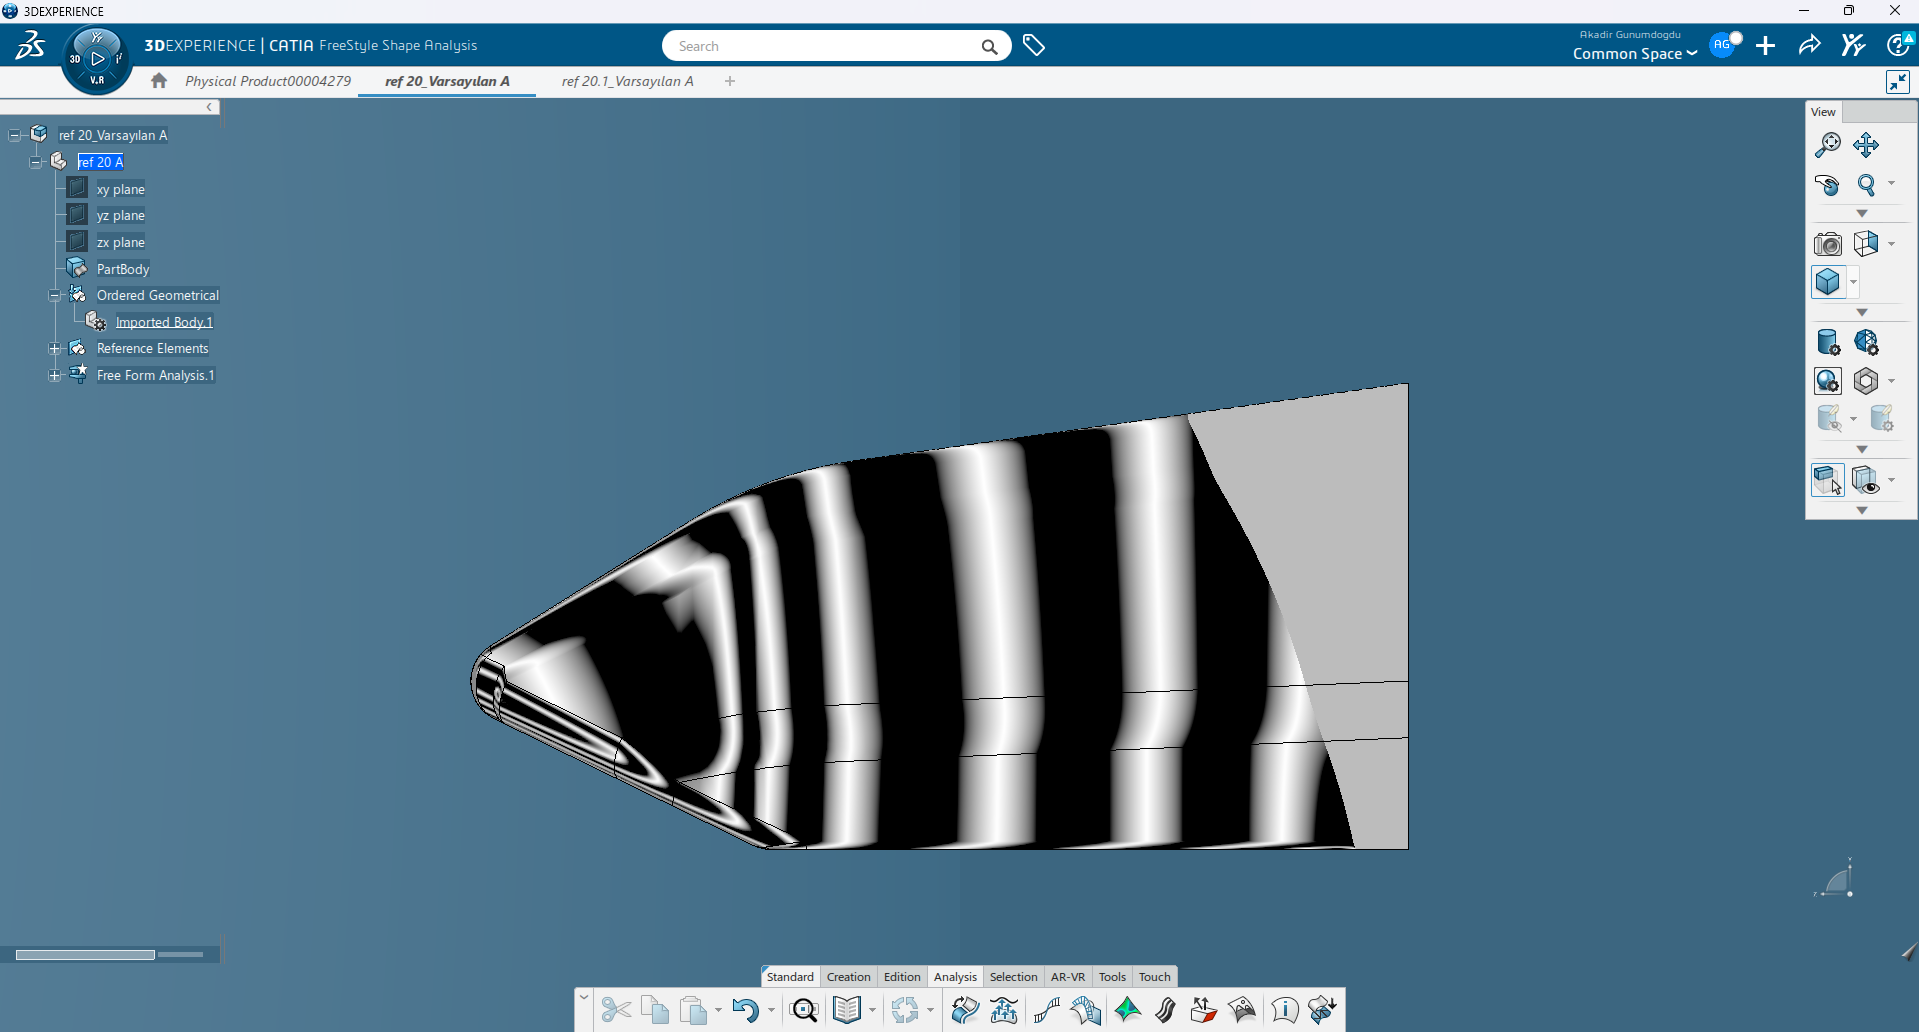
Figure 4. Side view showing stripe continuity across the upper, side, and lower bodywork surfaces.
What I Observed
Overall, the larger side panels showed a consistent stripe pattern, suggesting good surface continuity. The nose, however, along with several transition areas between the upper, side, and lower bodywork, displayed more noticeable changes in the reflection lines.
Not every interruption indicated a modeling problem. Some changes were expected because they reflected intentional styling features or functional design decisions. Instead of treating every irregularity as an error, I used Zebra Analysis as a screening tool to identify areas that deserved further investigation using CATIA’s continuity and curvature analysis tools.
Once I had completed the visual inspection, I wanted to validate the geometry with measurable data. That’s where Connect Checker became the next step in the workflow.
Unlike Zebra Analysis, which provides a visual indication of surface quality, Connect Checker evaluates the actual continuity between neighboring surfaces. It can measure positional continuity (G0), tangency (G1), and curvature continuity (G2 and G3), making it a valuable tool for identifying geometric inconsistencies before CFD.
For this initial evaluation, I focused primarily on G0 continuity. My objective was to detect any unintended gaps that could create problems when generating a closed fluid domain or producing a high-quality mesh.
Across the 80 surface connections included in this study, CATIA reported a maximum G0 deviation of just 0.001 mm, while most boundaries showed no measurable gap at the displayed precision. This indicated that the imported geometry was generally well connected.
I didn’t place much emphasis on the overall G1, G2, or G3 values at this stage because the model included several intentional sharp edges and styling transitions where tangent or curvature continuity wasn’t expected. A more meaningful evaluation would involve isolating only the boundaries designed to be smooth and assessing their continuity independently. The Connect Checker confirmed that the geometry was suitable for the next stage of the workflow, while also identifying areas that would benefit from closer inspection during curvature analysis.
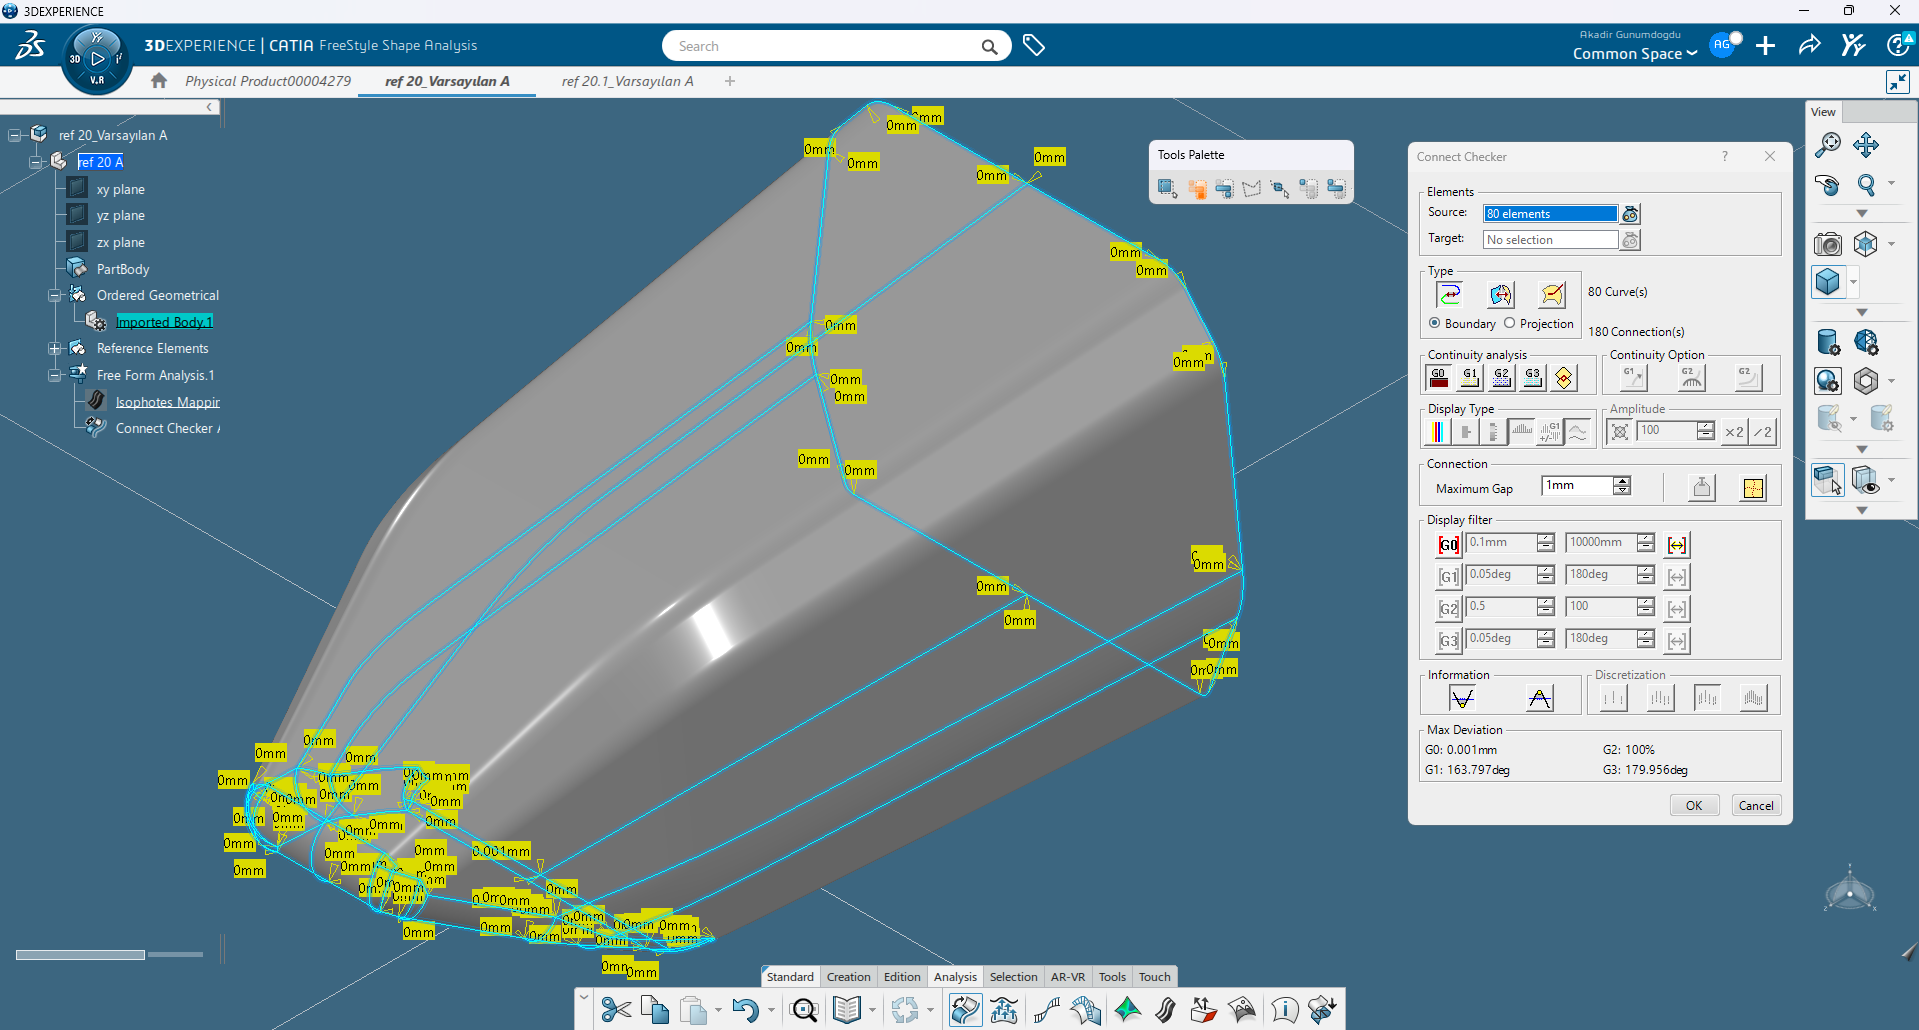
Figure 5. Connect Checker evaluating G0 continuity across 80 bodywork connections.
After checking the surface connections, I wanted to take a closer look at how the bodywork’s curvature changed across the model. For this, I used Porcupine Curvature Analysis, a tool that provides a visual representation of curvature using a series of spikes, often referred to as a curvature comb.
The length and direction of these spikes make it easier to spot sudden changes in curvature, irregular transitions, and potential inflection points that may not be obvious in a shaded view. This makes Porcupine Analysis particularly useful when evaluating the quality of complex freeform surfaces.
For my first evaluation, I selected the entire imported bodywork to get an overall picture of the model. As expected, the result was quite dense. Since the curvature comb was displayed along numerous surface boundaries simultaneously, areas around the nose and lower bodywork became crowded, making detailed interpretation more challenging.
Even so, this initial overview was valuable. It quickly highlighted the regions that deserved a more detailed investigation in the next stage of the workflow.
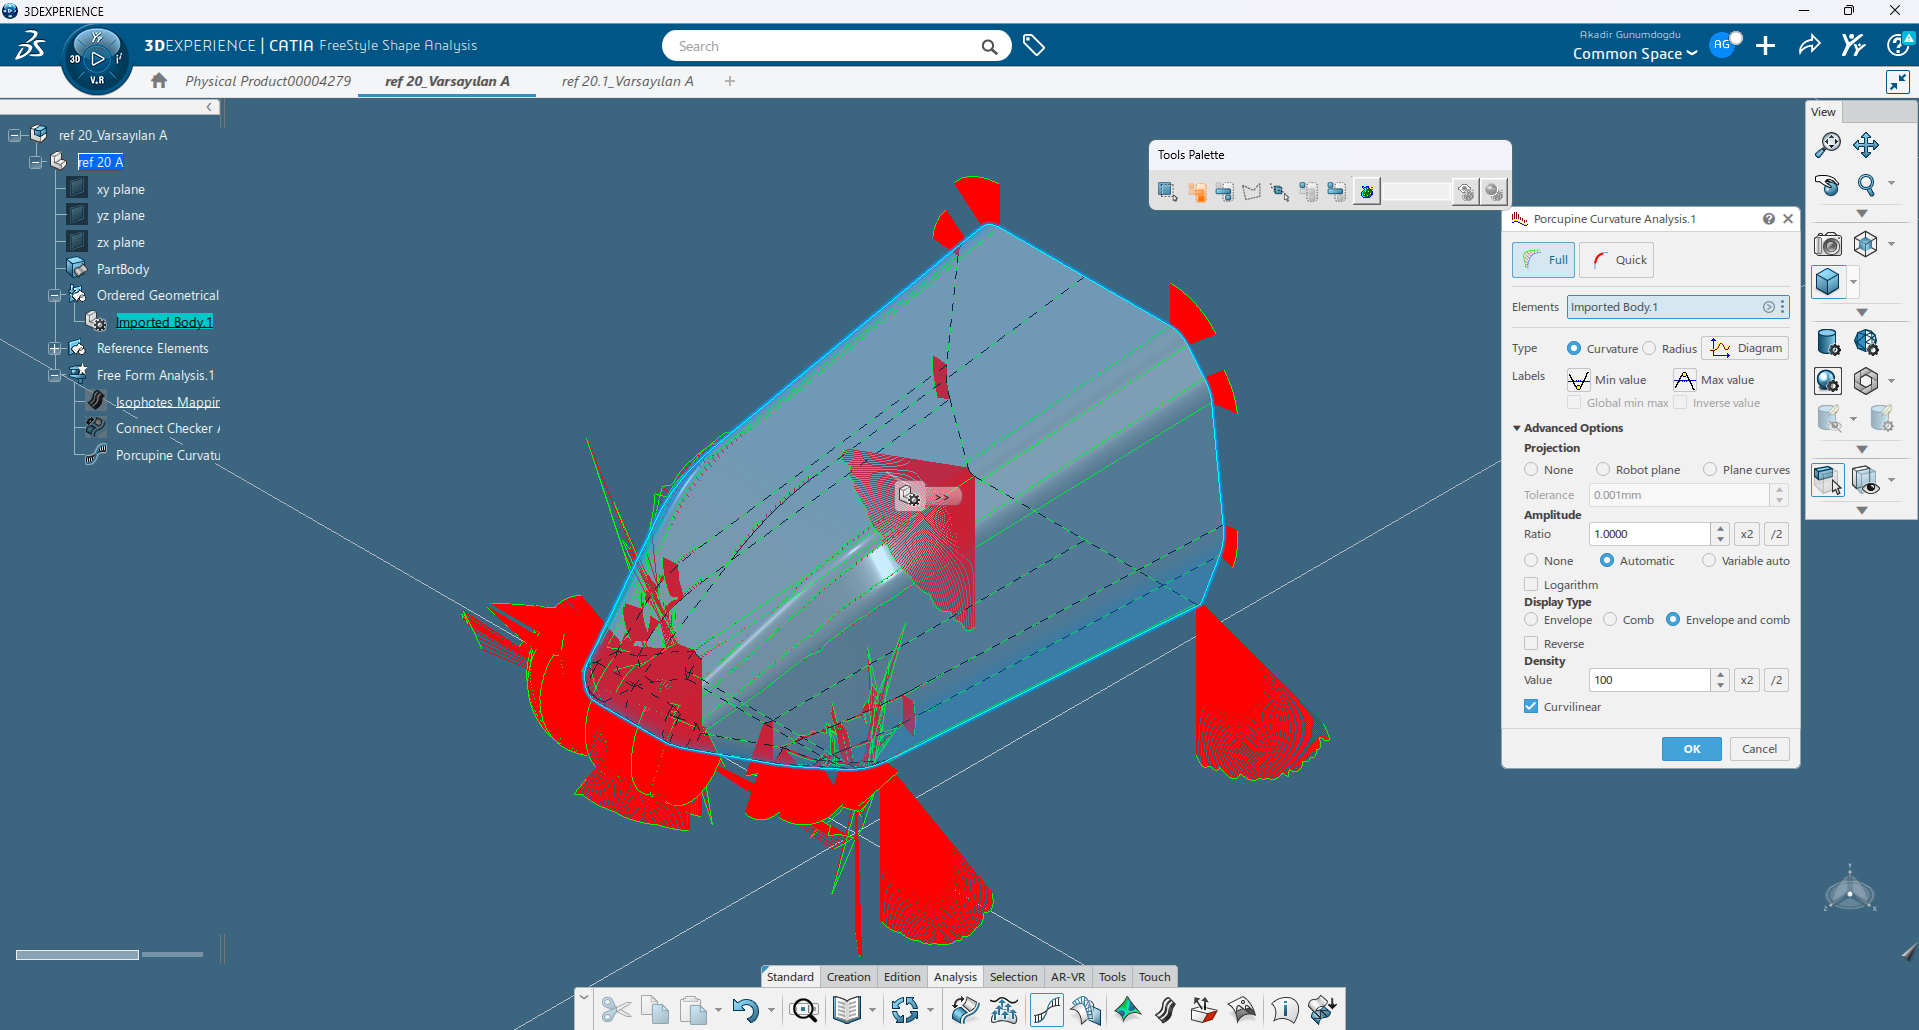
Figure 6. Initial Porcupine Curvature Analysis of the bodywork geometry.
What I Learned
Viewing the complete model at once was useful for identifying potential problem areas, but it wasn’t the best approach for detailed analysis. The large number of curvature combs often overlapped, making it difficult to distinguish actual curvature changes from visual clutter.
If I were repeating this study, I would analyze smaller sections individually, focusing on selected boundaries or cutting-plane curves. Reducing the comb density would also make subtle curvature variations much easier to interpret and compare.
While Porcupine Analysis doesn’t provide aerodynamic results, it offers valuable insight into the geometric behavior of a surface before moving into CFD.
With the continuity and boundary curvature checks completed, the next step was to examine how curvature was distributed over the entire bodywork.
Unlike Porcupine Analysis, which focuses on curves and boundaries, Surfacic Curvature Analysis evaluates the complete surface and displays curvature as a color map. This makes it much easier to identify regions where curvature changes gradually versus areas with more complex geometric behavior.
For this study, I selected the Square Root Gaussian curvature option. This visualization provided a clear overview of the body’s overall curvature distribution and allowed me to compare different regions of the design more effectively.
The larger side panels and upper surfaces displayed broad, consistent color patterns, suggesting relatively smooth curvature transitions. Around the nose, the lower front section, and several smaller transition surfaces, however, the color distribution became noticeably more complex.
It’s important to note that these variations didn’t automatically indicate poor geometry. Many were expected because of intentional design features, tight radii, or sharp styling transitions. Instead, the analysis helped identify areas that warranted a closer inspection before CFD.
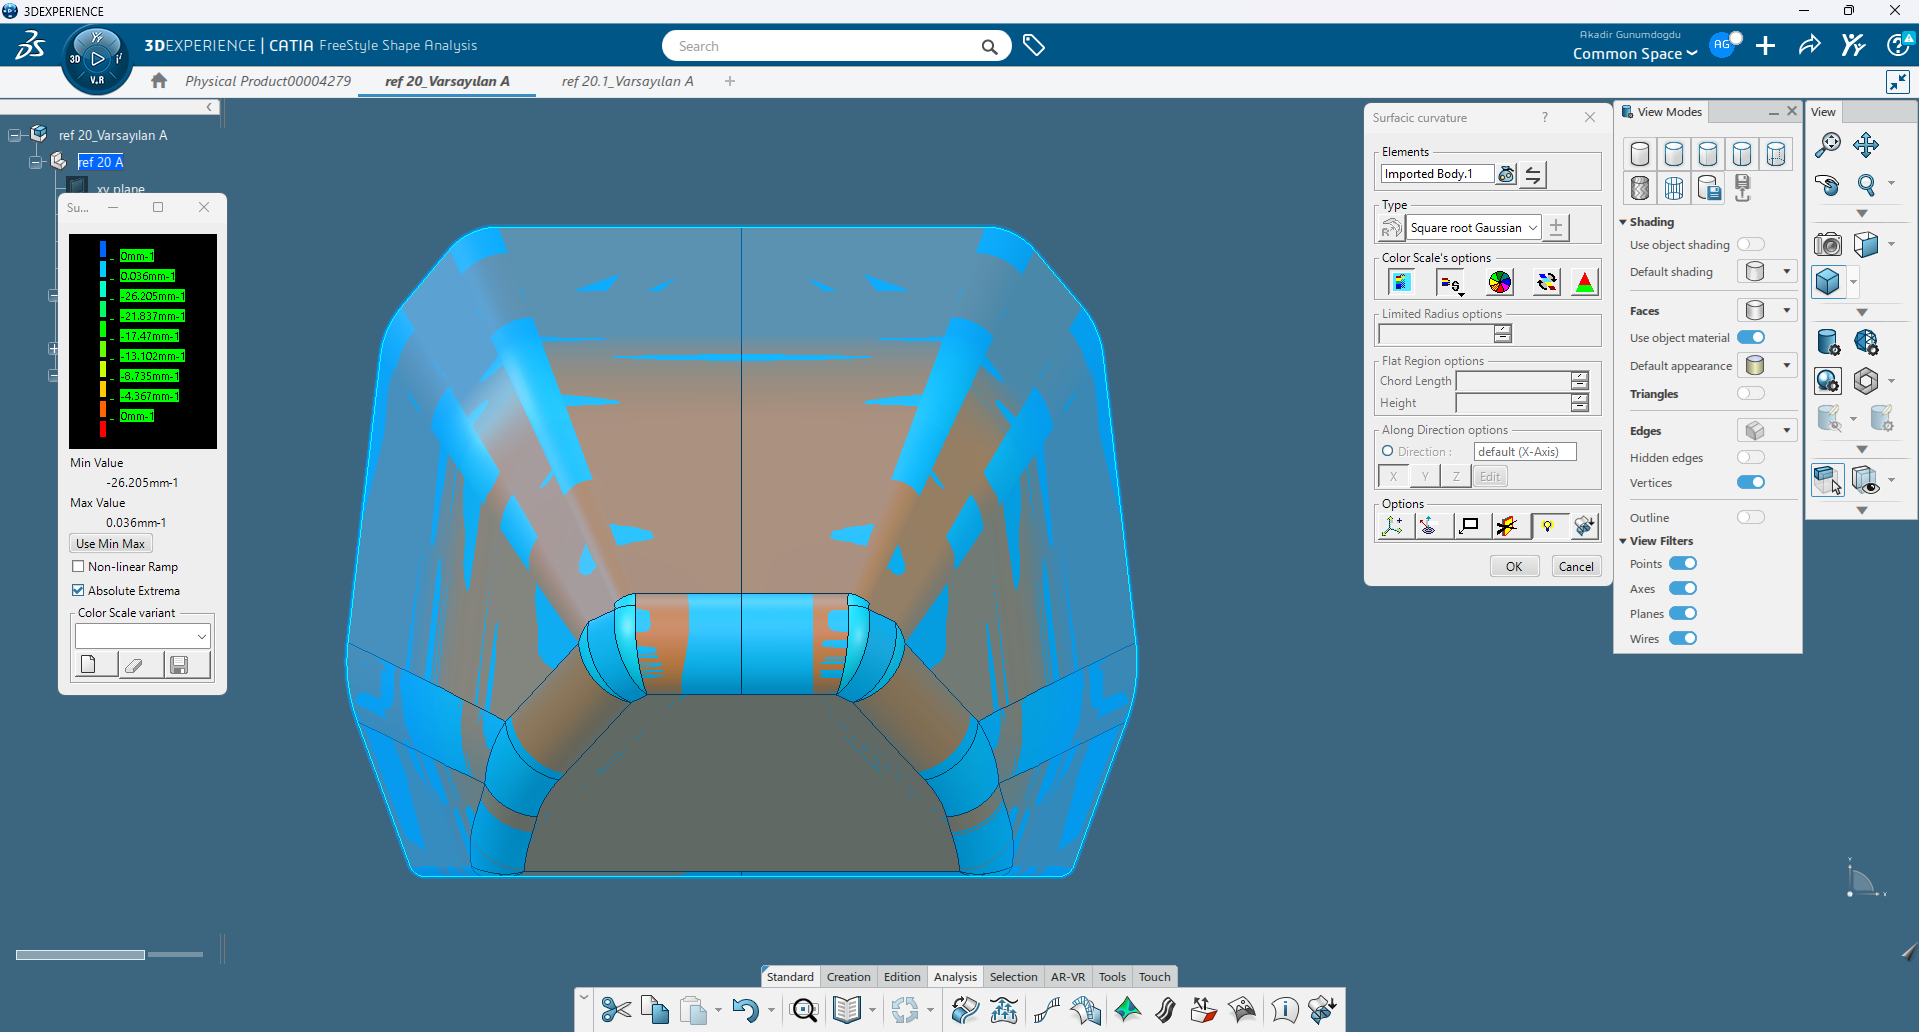
Figure 7. Front view of the Surfacic Curvature Analysis.
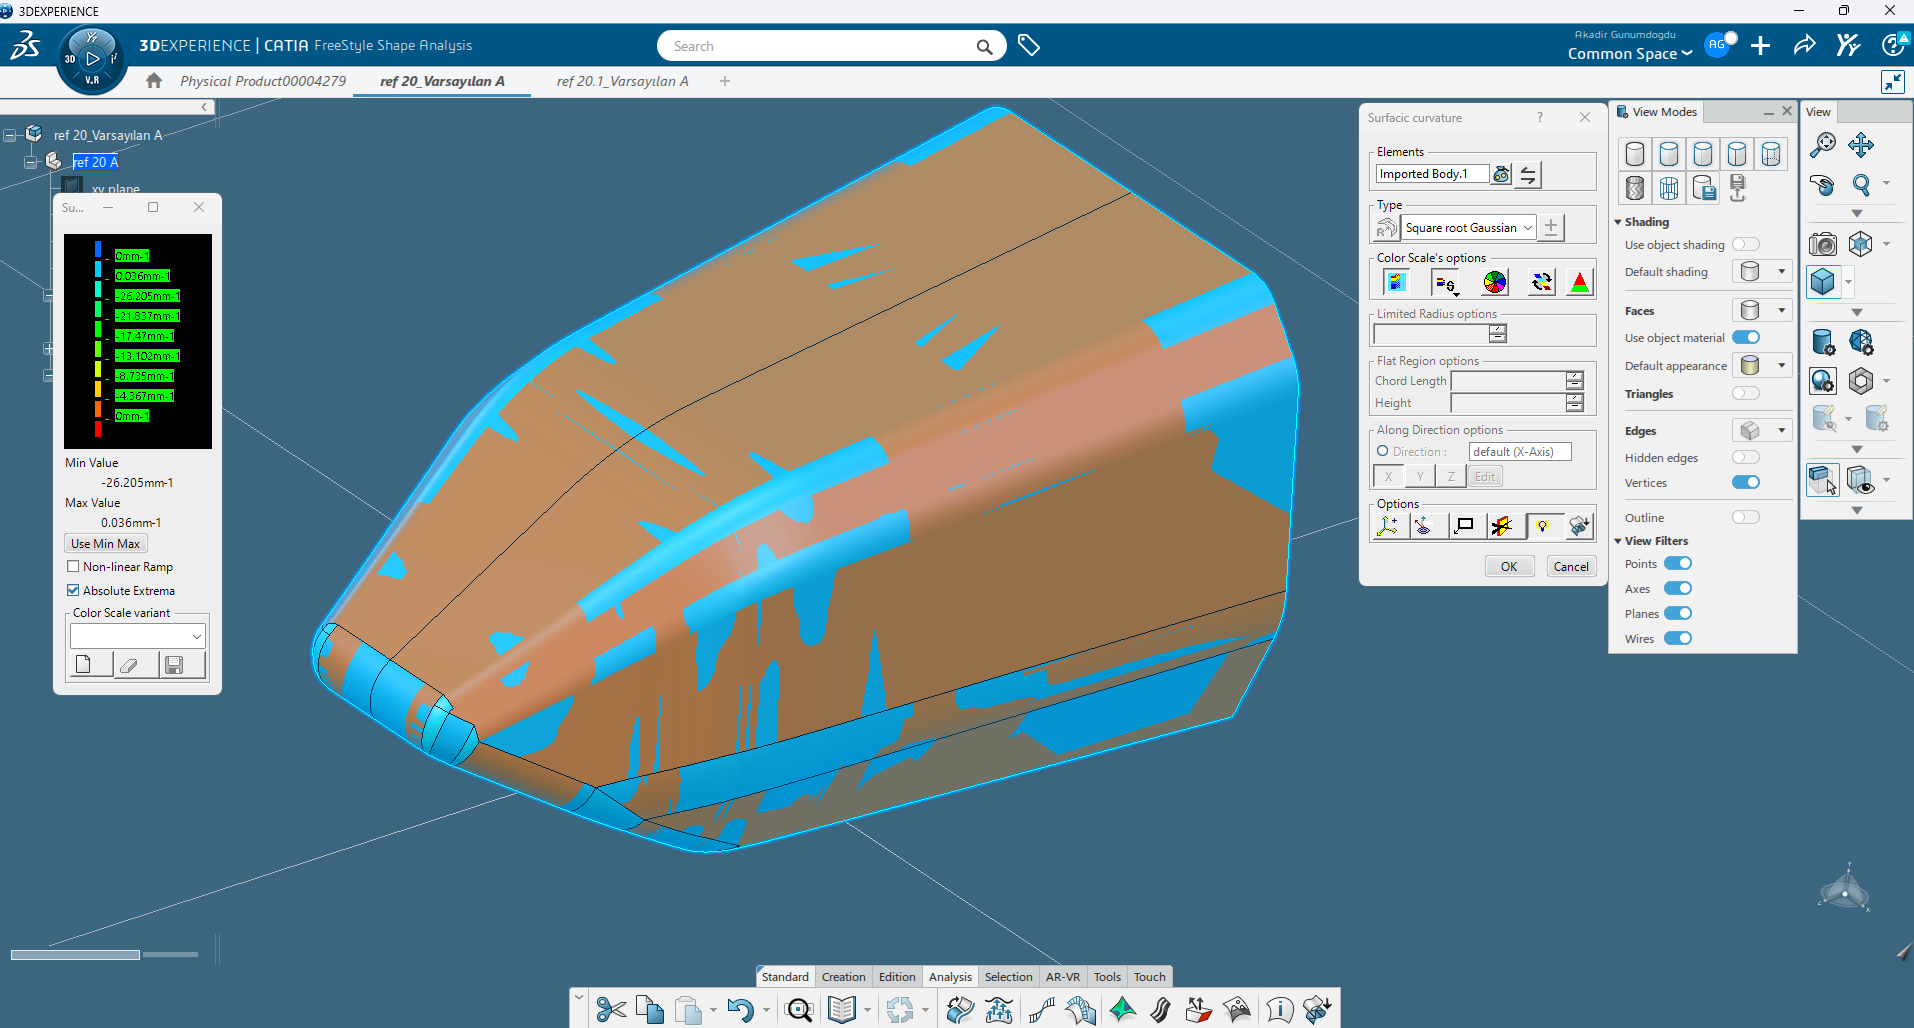
Figure 8. Isometric view showing curvature distribution across the bodywork.
Key Observation
One of the most interesting findings was the clear difference between the larger body panels and the nose region. While most of the bodywork showed relatively uniform curvature, the nose exhibited much more variation, supporting the observations already made during the Zebra and Porcupine analyses.
Although this wasn’t an aerodynamic study, it gave me greater confidence about where to focus my attention during the CFD phase. Rather than treating every geometric variation as a defect, these analyses helped prioritize the regions that were most likely to influence the simulation.
After completing the surface analyses, one thing became clear: the nose consistently appeared as the most critical area of the bodywork.
Every analysis—Zebra, Connect Checker, Porcupine, and Surfacic Curvature—highlighted noticeable geometric changes around the front of the car. Some of these transitions were intentional and necessary to achieve the desired shape, but surface analysis alone couldn’t determine whether they would have a positive or negative impact on aerodynamic performance.
That’s where SIMULIA CFD became the next step.
The nose is the first major section of the bodywork to interact with the incoming airflow. As air reaches this region, it begins to slow down, accelerate around the vehicle, and establish the pressure distribution that influences the rest of the bodywork. Even relatively small geometric changes can affect stagnation pressure, flow acceleration, pressure recovery, and, in some cases, the likelihood of flow separation.
For a Formula Student car, this becomes even more important because the nose doesn’t work in isolation. It directly influences the airflow reaching the front wing and the downstream aerodynamic components. A visually smooth surface isn’t necessarily an aerodynamically efficient one.
The surface analyses helped me understand where to look. The next objective was to determine whether those geometric characteristics actually affected the airflow by evaluating the bodywork in SIMULIA CFD.
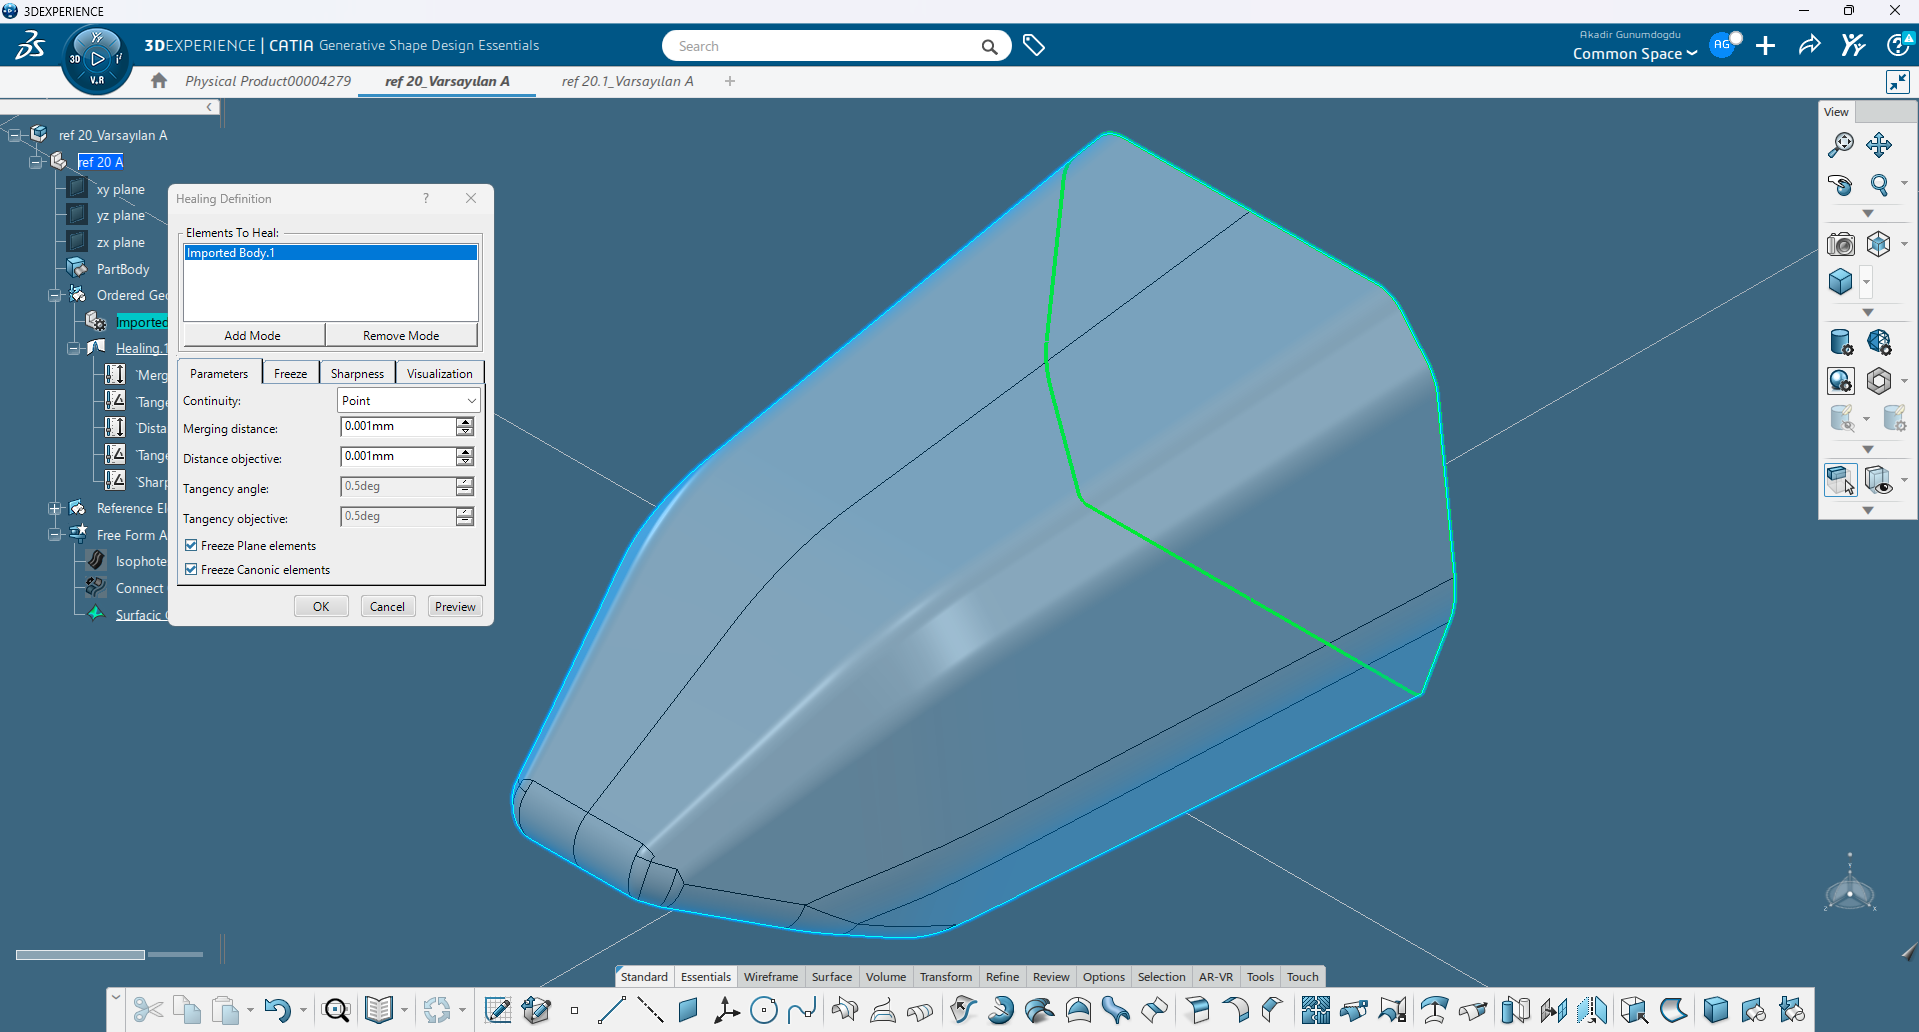
Figure 9 – Healing imported geometry before CFD.
This first step showed me that preparing a model for CFD involves much more than creating a good-looking CAD design. Using CATIA’s surface analysis tools helped me better understand the geometry, identify areas that needed attention, and build more confidence before moving into simulation.
In the next article, I’ll continue the workflow by taking this model into SIMULIA Fluid Dynamics Engineer, where I’ll cover the CFD setup, mesh generation, and share the first aerodynamic results.



[…] Part 1, I focused on evaluating the quality of the Formula Student bodywork using CATIA Surface Analysis. […]